It is the end of the month. You dread it.
You spend 4 hours pulling data from Facebook Ads, Google Analytics, and SEO tools. You paste screenshots into a PDF. You write a generic summary: “Traffic is up 5%.” You hit send.
And then… silence.
The client doesn’t reply. Or worse, three months later, they fire you because “we don’t see the value you’re providing.”
Here is the harsh truth: Clients do not fire agencies because of bad results; they fire them because of bad communication.
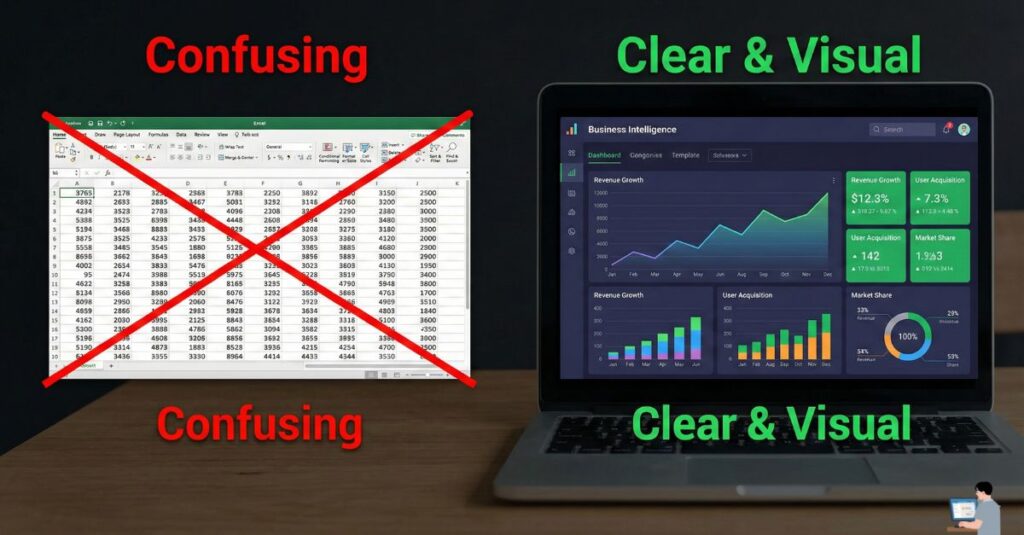
Most client reports are “Data Dumps”—boring spreadsheets that confuse business owners. Your client doesn’t care about “Bounce Rate”; they care about “Revenue.”
Welcome to Client Reporting 2.0. In this guide, I will show you how to use AI to stop being a “Data Reporter” and start being a “Strategic Partner.” We will automate the boring numbers and use AI to write a narrative that proves your worth.
Table of Contents
The Problem: Why Clients Ignore “Data Dumps”
At its core, Client Reporting is the process of updating your customer on their investment.
Traditionally, an analyst manually copies numbers into Excel. But in 2026, that job is dead. The new job is Insight Extraction.
- The Old Way: “Here is a chart showing we got 1,000 clicks.” (So what?)
- The New Way (AI): “We got 1,000 clicks, which generated $5,000 in sales. This is a 20% increase from last month because we fixed the checkout page.”
Step 1: Automate the Dashboard (Single Source of Truth)
Never copy-paste data manually again. You need a Live Dashboard that pulls all metrics (Ads, SEO, Social) into one link.
Tools to Use:
- AgencyAnalytics: The industry standard. It connects to everything and has a “AI Summary” button built-in.
- Looker Studio (Free): Connects to Google Analytics/Ads for free.
- Databox: Great for visualizing KPIs on mobile.
Step 2: The “Junior Analyst” Prompt (Finding the Story)
This is where the magic happens. You need to turn raw numbers into a business story.
The Workflow:
- Take a screenshot of your dashboard metrics (or upload the CSV).
- Paste it into ChatGPT Plus or Claude.
- Use this prompt to generate the narrative.
Copy This Prompt:
“Act as a Senior Marketing Strategist. Analyze this data for my client [Client Name].
1. Identify the one metric that improved the most and explain why (link it to a specific action we took). 2. Find one metric that is down and explain our plan to fix it (so they don’t panic). 3. Write a 3-sentence Executive Summary focused on ROI and Revenue, not technical jargon.
Tone: Professional, confident, and concise.”
Step 3: The “So What?” Test (Adding Value)
AI is great at data, but it lacks context. You must pass the “So What?” Test.
- AI says: “Organic traffic is down 10%.”
- You add: “…Because it was a holiday month. However, conversion rate is UP, so you actually made more money.”
The Perfect Report Structure:
- The “Hero” Number: (Total Revenue or Leads). Put this at the very top.
- The Executive Summary: (The 3 sentences written by AI).
- The “Wins”: What went right?
- The “Learnings”: What went wrong, and how are we fixing it? (Clients trust you more when you admit problems with a plan).
Pro Tip: The “Loom Cameo” (The Secret Weapon)
If you want to guarantee your client reads the report, don’t make them read.
The Strategy:
- Open your PDF report on your screen.
- Use Loom to record a 60-second video of yourself scrolling through it.
- Say this: “Hey [Client Name], great month. I just wanted to highlight this one number on page 2—we hit a record high. Check out the PDF for details.”
- Embed this video at the top of the email.
Why this works: It builds a human connection. They see your face, hear your excitement, and feel taken care of. AI writes the text; YOU deliver the relationship.
")
Video Insight: AgencyAnalytics Walkthrough
Want to see how to set up these automated dashboards in minutes? Watch this walkthrough from the AgencyAnalytics team (the tool I personally recommend):
(Video Title: Win More Agency Clients with Better Reporting | AgencyAnalytics Walkthrough)
FAQ: Real Questions, Honest Answers
Q: Can I use AI to write reports? Is it 100% trustworthy?
A: No. AI is a reasoning engine, not a calculator. It can sometimes hallucinate numbers. The Rule: AI writes the text, but you must verify the numbers against your dashboard.
Q: How is AI detected in reports?
A: Clients can smell “Lazy AI” if you use generic words like “delve,” “landscape,” or “tapestry.” Always edit the AI output to sound like you.
Q: What is “Read AI”?
A: Read.ai is a specific tool that joins your Zoom/Teams meetings and generates a “Meeting Report” automatically. It is fantastic for “Client Update Calls” because it emails the client a summary so you don’t have to take notes.
Final Verdict: Data Tells, Stories Sell
Your clients are busy. They don’t pay you for spreadsheets; they pay you for peace of mind.
- If you send a 20-page PDF, you are giving them homework.
- If you send a 1-page AI summary with a personal video, you are giving them answers.
Tools to Start With:
- AgencyAnalytics (For the Data)
- ChatGPT/Claude (For the Narrative)
- Loom (For the Human Touch)